
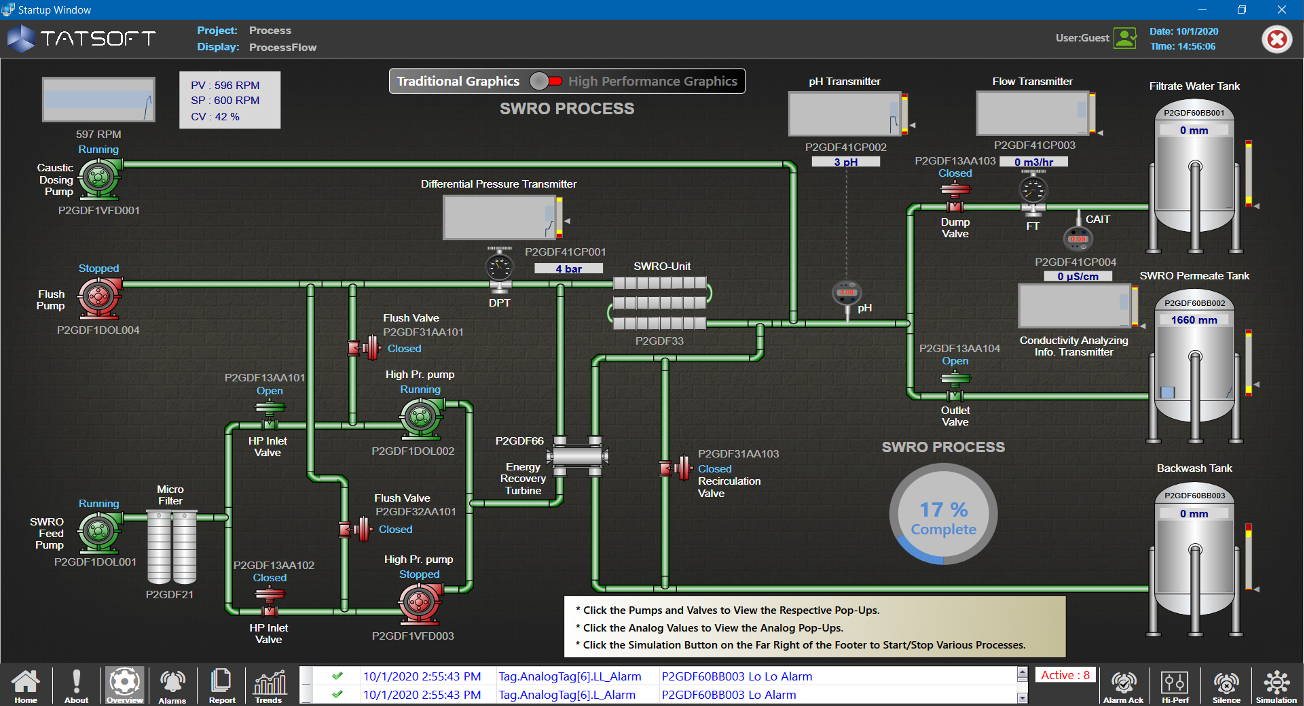
Traditional Graphics and Powerful Symbols allow you to quickly create and customize your projects of any size.
Build Enterprise software that runs on multiple platforms – Windows, Linux, iOS, and HTML5, all from the same engineering environment.
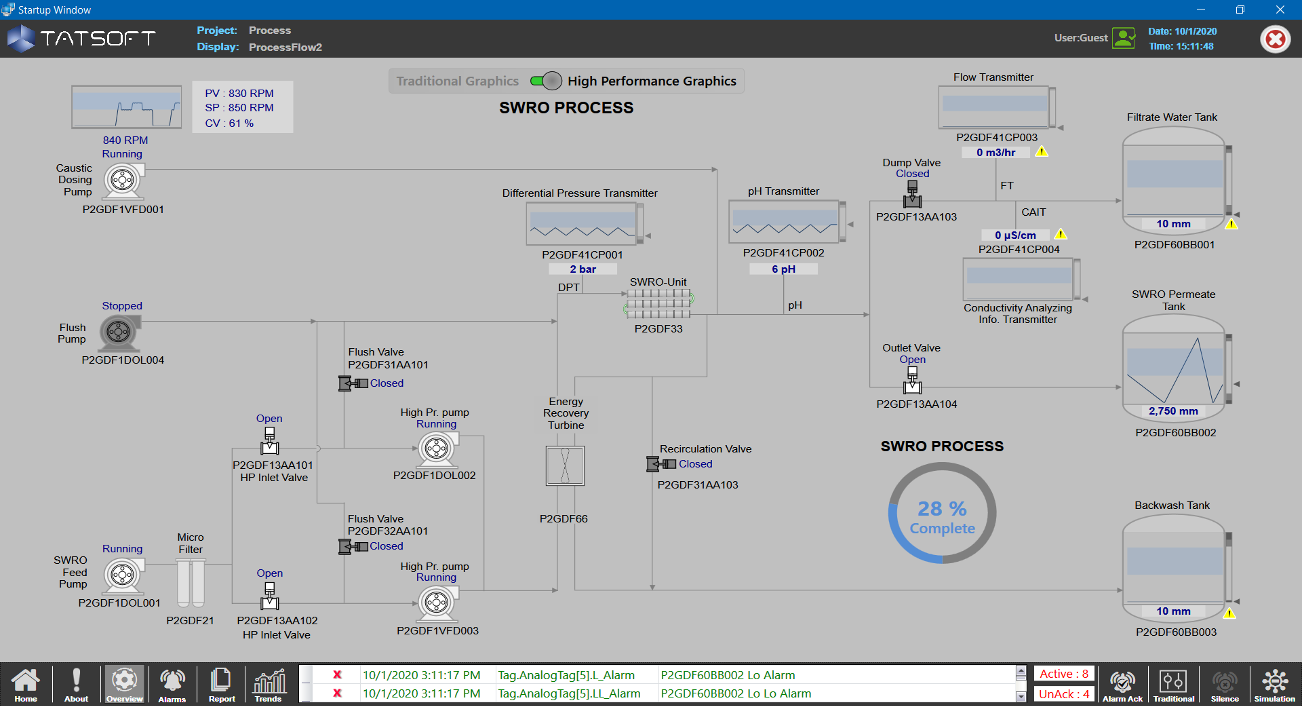
High Performance Graphics allows your operators to quickly find and focus on the issues they need to respond to in order to keep your processes running at top efficiency.
Easily modify symbols to include as little or much animation as you like.
Easily customize symbols to show state based on incoming or calculated values, in real-time.
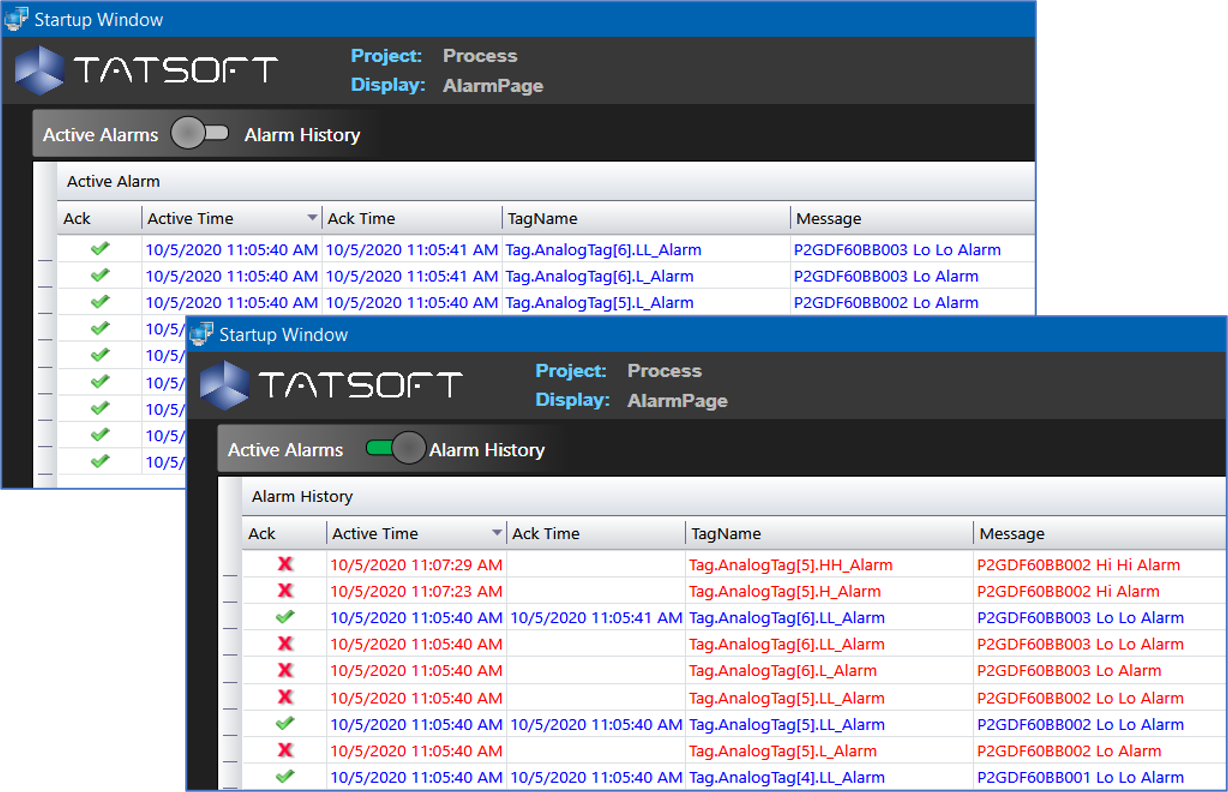
Built in Alarm Management, Alarm History, Alarm Acknowledgement make alerting and recording your alarms super easy.
- Easily customize what you want to show.
- Show alarms on screen, or in a report
- Acknowledge and / or Silence alarms
- Use Alarms to alert maintenance, management, or anyone via options for on-screen messages, emails, SMS (text), even Voice Alerts – all built in!
Easily provide context information via pop-ups, tool-tips, trends, charts, or entire screens.
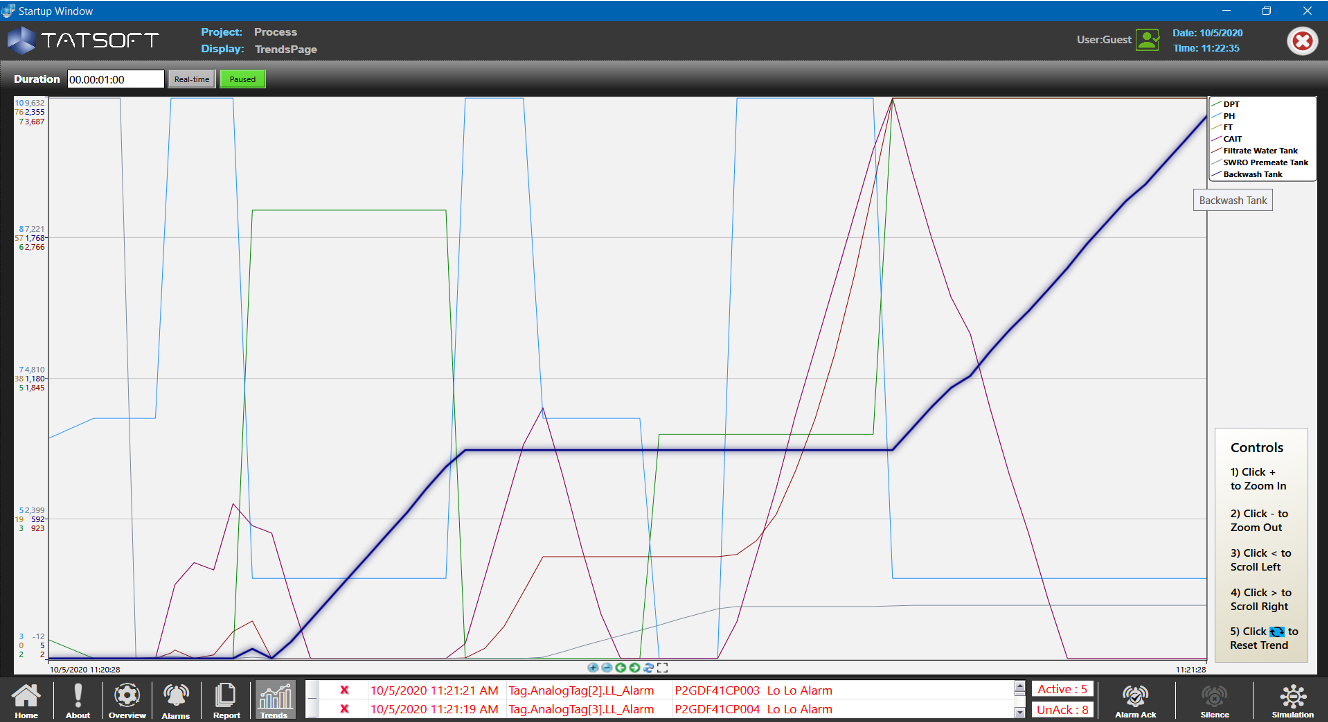
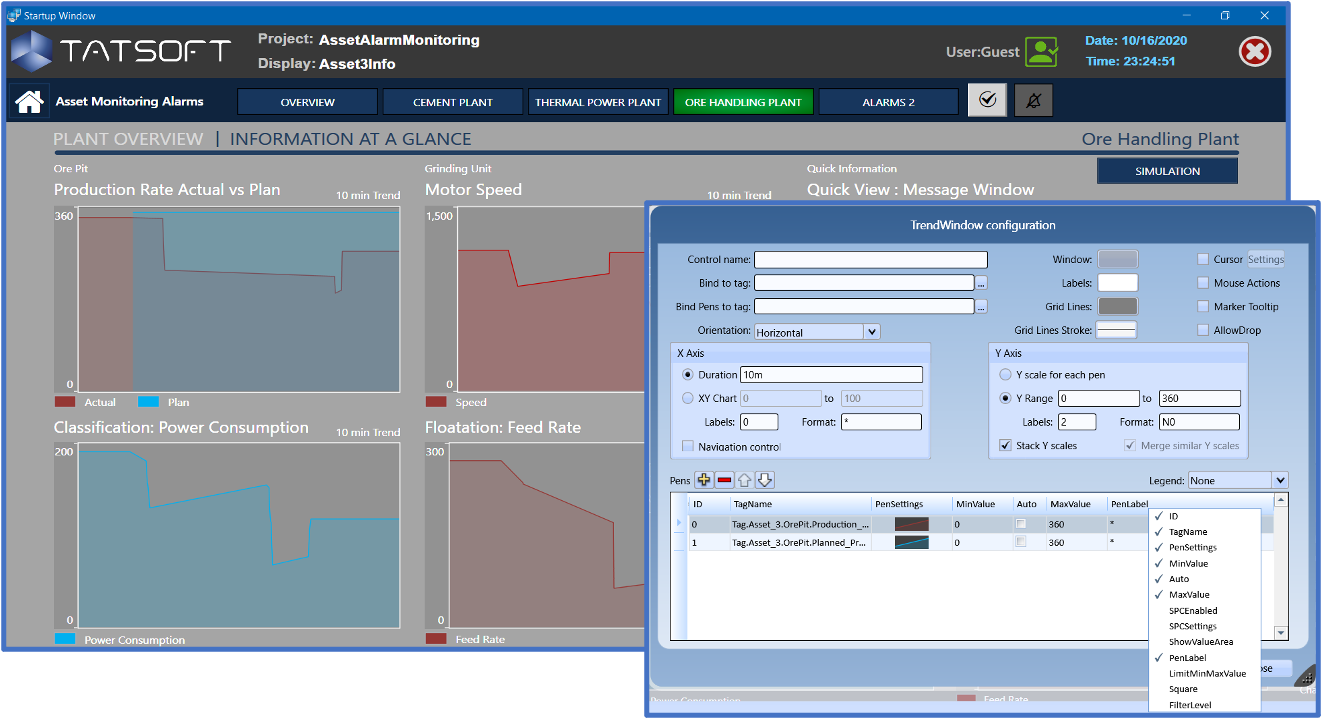
Powerful chart customizations are made easy with Tatsoft’s trend chart configuration interface.
Built-in date selectors, zoom-in/out, highlight pen, show/hide pens, multiple-axes and more!
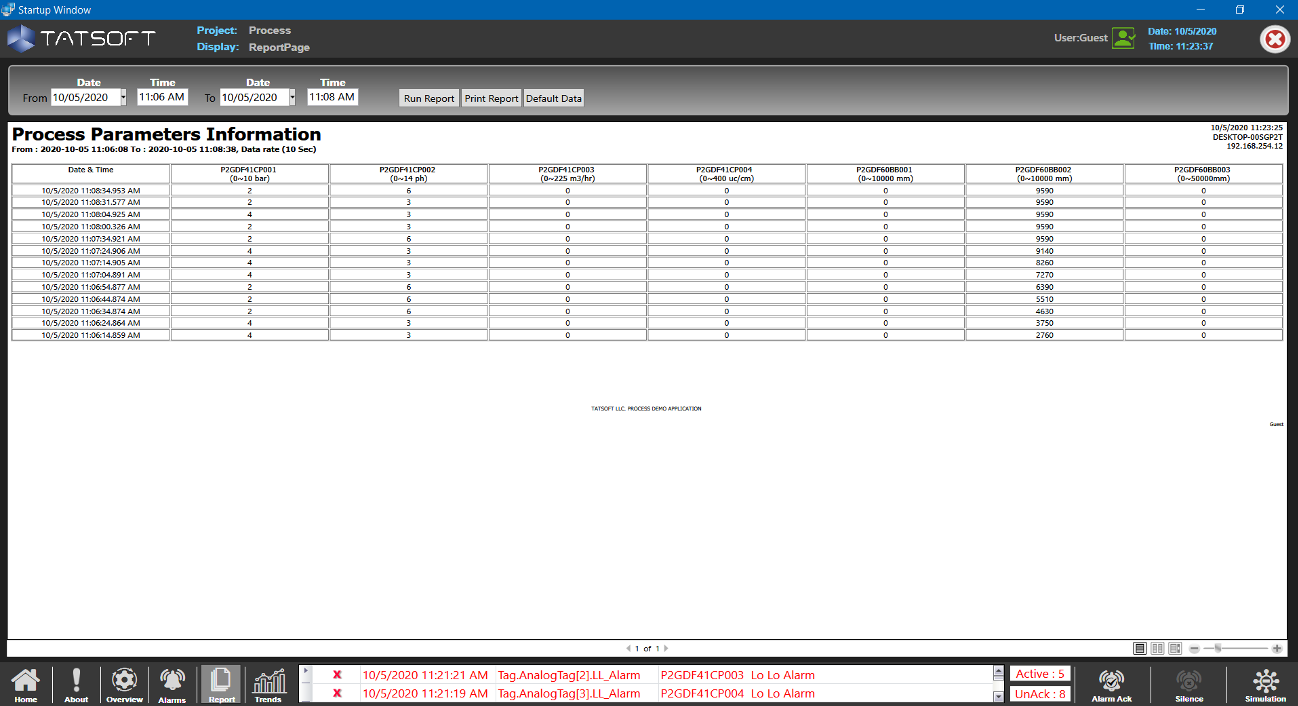
Easily generate reports on-demand or on a schedule.
Include real-time up-to-date charts and data grids when the reports are run.
Easily customize the report layout to meet regulatory layouts.
View, Save, or e-mail reports – all from within your project!
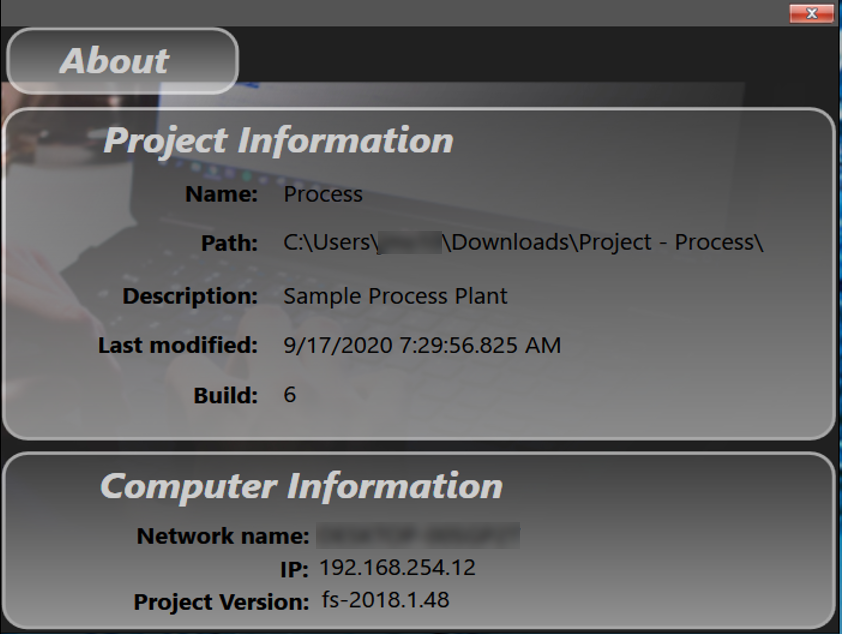
Access project and client information easily from within your project. Any item in a client, server, or project is easily usable and viewable as you need.
You could use this information to help drive security (for example, who can see what), track connections (IP, Computer name, etc), and more!
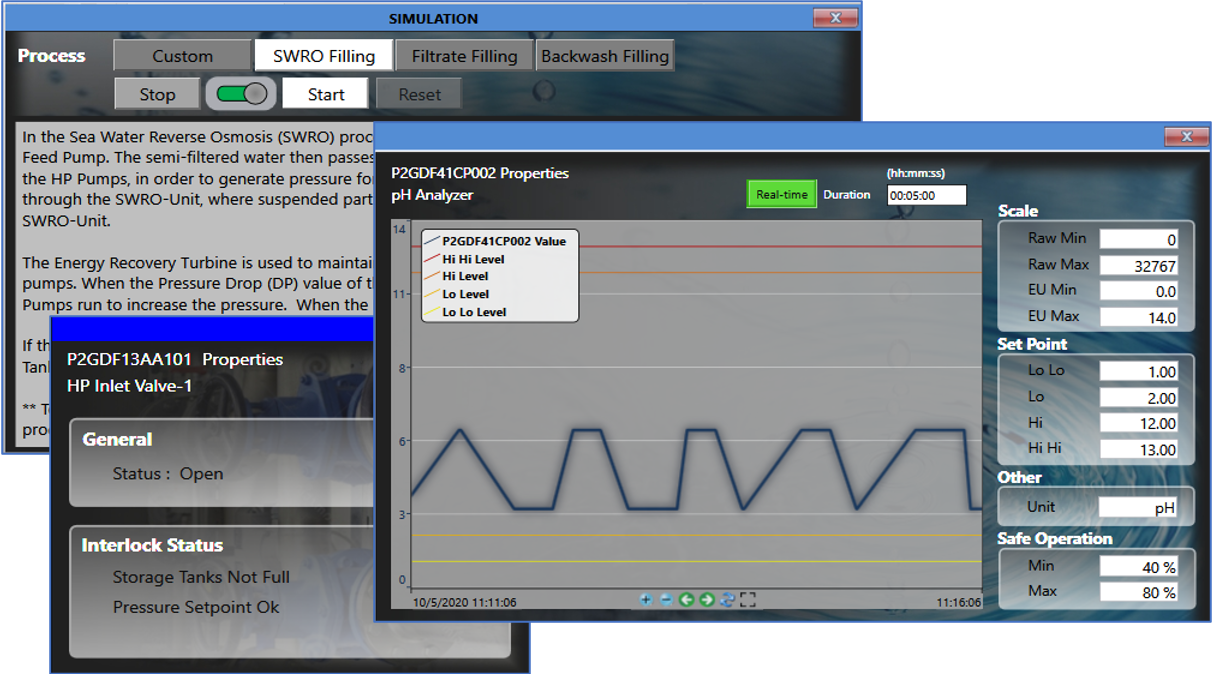
Digital Twins can help speed your R&D and Training initiatives.
- Build Digital Twins with high-speed graphics to simulate your processes
- Mimic real-time processes
- Simulate various conditions
- Test operator responses to simulated scenarios
- Train operators on new processes ahead of time
- Train new operators on proper operations while letting them safely experiment with simulated controls and system responses – and see its impact on the business
Build interactive learning applications to help train users. A great way to create content for all the users in your enterprise or plant, on the same system used to deliver that content.
You could:
- Deliver specific content to users based on Active Directory integrated Roles and Groups
- Ensure staff was up to speed on new changes prior to rollout
- Track user engagement
- Graphically explain new processes and concepts
- Collect user feedback
- Add annotations to charts and chart history

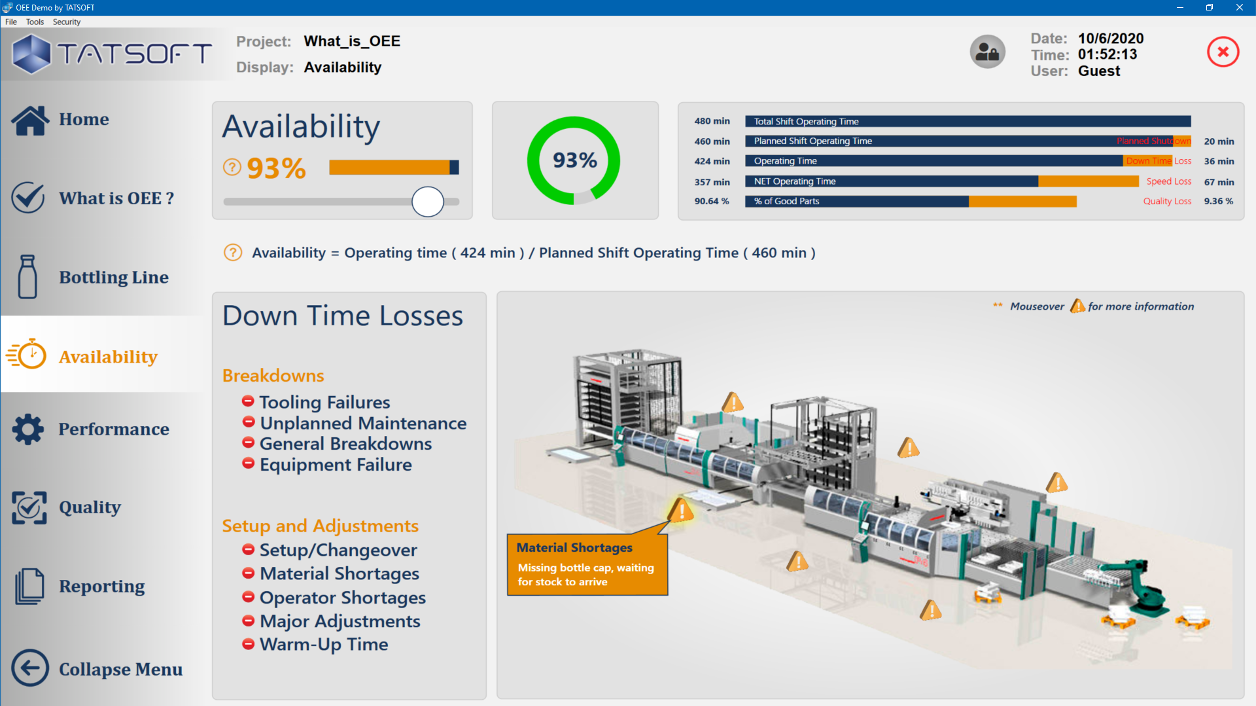
Easily build any menu style you need – even multiple menu styles in the same project.
Our “What is OEE” demo project shows off both an expanded and collapsed menu style.
Place menus on any side you want.
Control menu access, or even specific button access (and visibility!) via integrated Active Directory and/or built-in user security.
Use our default menu(s) or easily build your own.
Build intelligent menus that show different options depending on the screen, context, or even condition as needed.
Make your projects as realistic as you need – whether you need our included High Performance “flat/grey/white” graphics, or want to create a life-like replica of your processes.
Update your animation based on real-time PLC values or use a simulator.
Visualize real time status, state, and quality.
Use native fast graphic capabilities
Easily connect and control your project, plant, and enterprise with real-time, secure communications.
Drive system responses via on-screen controls as you’d expect (such as with buttons and sliders)
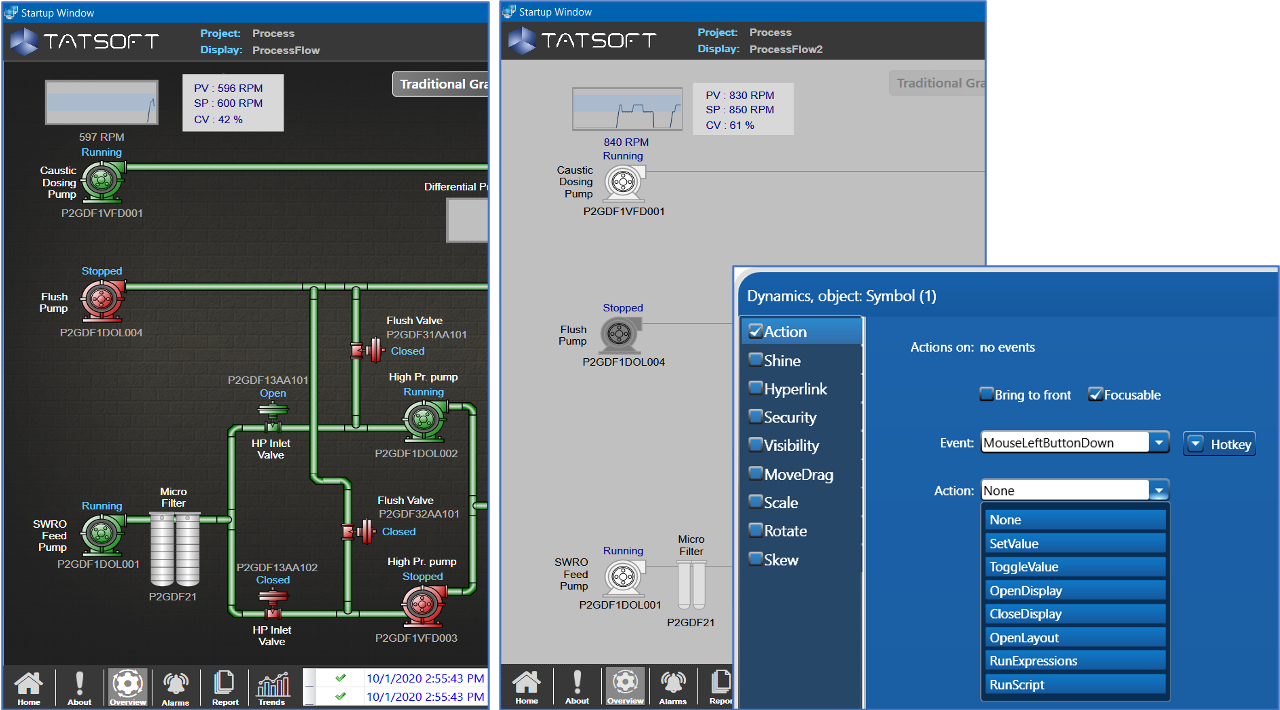
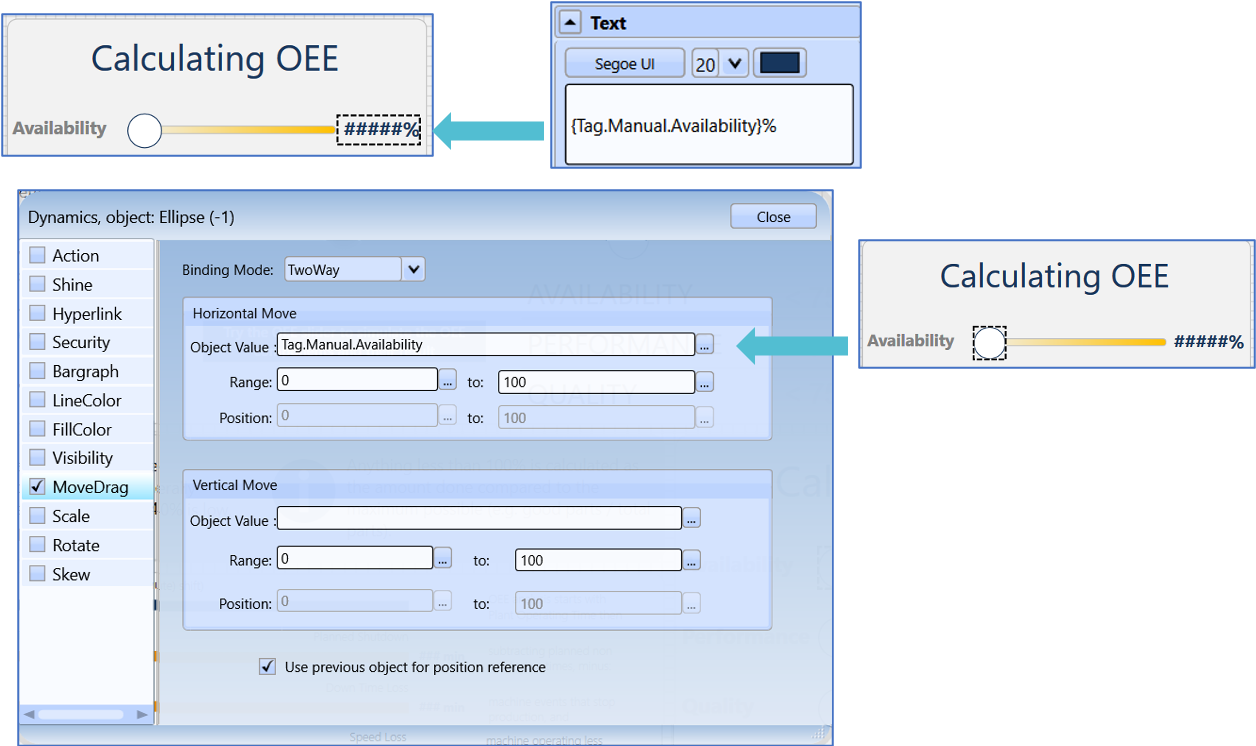
Easily update text, values, tags, graphics, and more a few simple clicks.
Make use of the power in our Dynamics control window to modify how something looks or reacts easily.
Copy dynamics from one object to another for fast project creation and reduced errors.
With a variety of actions supported on many components you can easily get a viewer’s attention when you need to…
… or use things like “hover” tool-tips to keep distractions out of the way except when needed.
Enlarge items, make them glow, make them move, make them appear/disappear, and more!
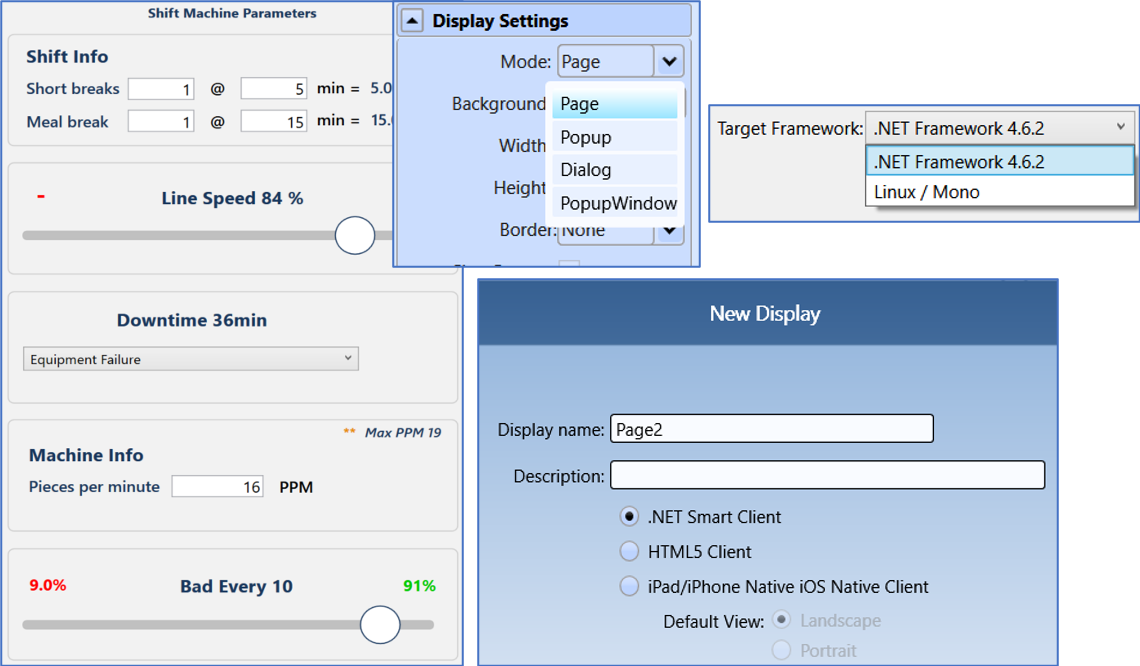
Maximize screen space by creating content that shows up only when you need it!
Create the type of screen you need for any situation, from a popup to an entire page.
Use Pop-Ups, as an example, for important items that don’t need to always be around – whether that’s a context-relevant chart, report, dialog box, simulation control, login, and more!
FactoryStudio, powered by FrameworX, gives you the flexibility you need to create projects of any size – from a multi-site Enterprise application to a single screen HMI or embedded system.
Design for multiple platform – Windows, Linux, HTML5, iOS – all from the same engineering environment.

Easily generate reports on-demand or on a schedule.
Include real-time up-to-date charts and data grids when the reports are run.
Easily customize the report layout to meet regulatory layouts.
View, Save, or e-mail reports – all from within your project!
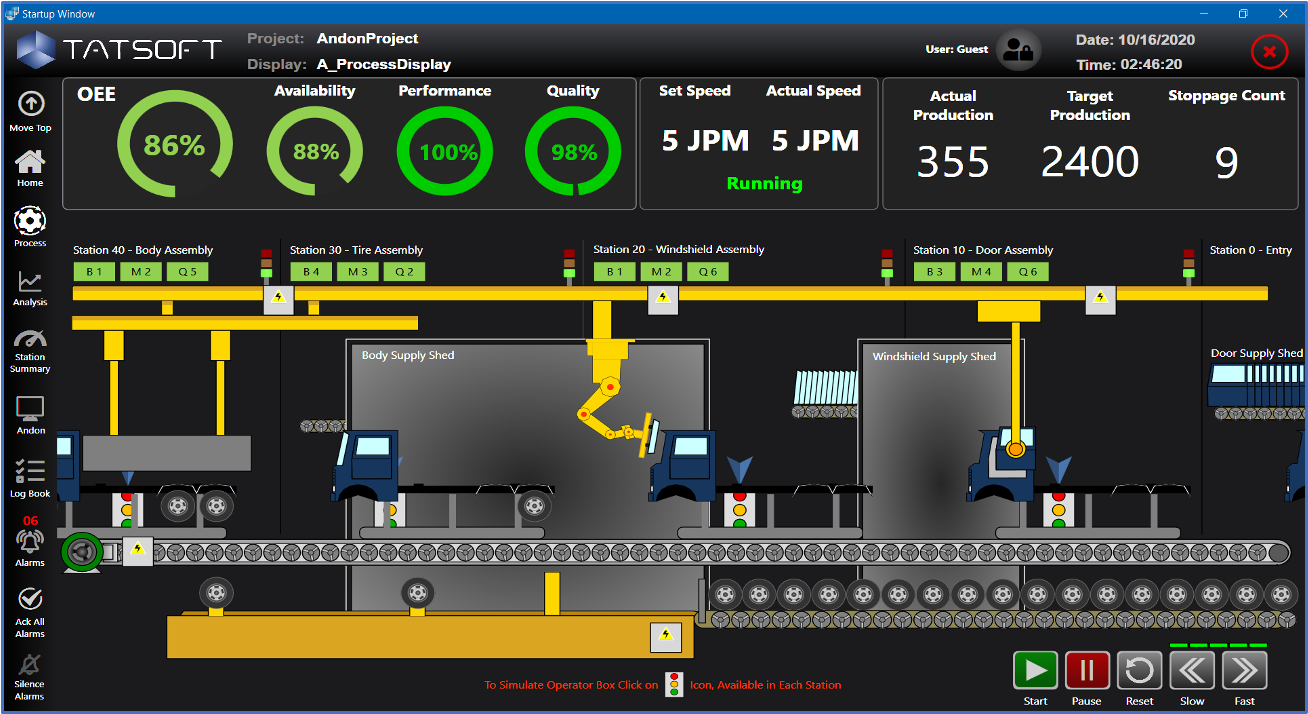
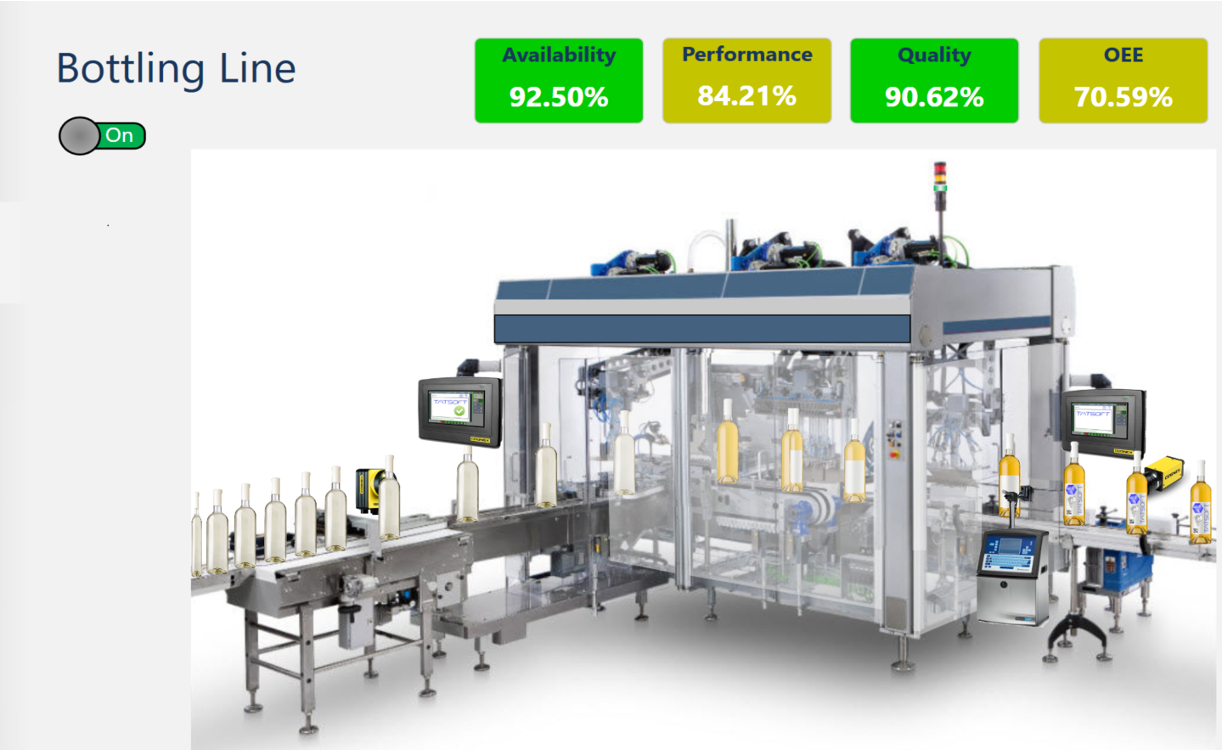
Animated representations of your production make it easy to keep an eye on production in real-time.
Animate a work cell, line, or even an entire plant.
Easily mimic real-time production movement, state, and error conditions.
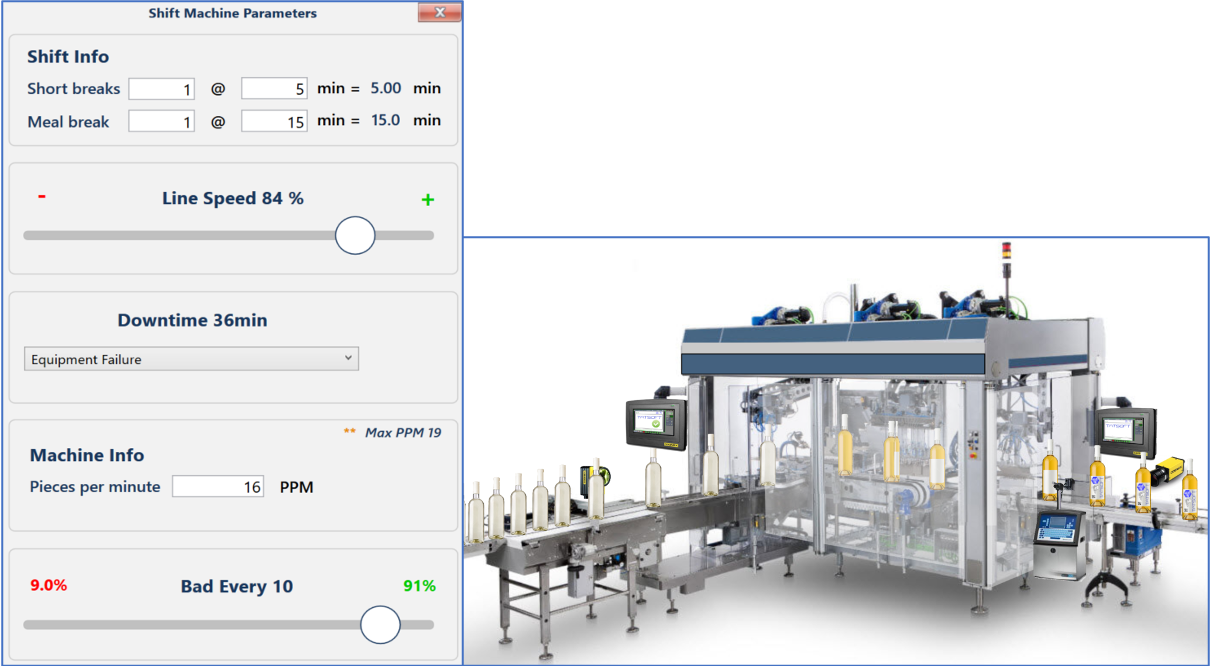
Create Simulation Controls to mimic real-life situations to enhance training and show the impact various scenarios have on output and profitability.

Build intuitive Interactive Controls to improve the efficiency and quality of your operations.
Reflect real-time conditions such as machine & product location, fault conditions, operator boxes, stack lights, and more.
Control your operations via touch on desktop, mobile, and browser.
Easily build industrial software solutions across many platforms, including Windows, Linux, iOS, and HTML5, all from the same Engineering Environment.
Easily integrate data from any system: e.g. ERP, WMS, CMMS, LIMS, CRM, database, historian, and PLCs.
Use our built-in visual SQL Query Builder to build and test your SQL Queries and verify data before adding it to your project.
Improve employee engagement by adding relevant extra-production data such as scrap cost or lost opportunity value (e.g. Downtime caused # of pallet losses during shift.)
Use ERP data with production data to help determine what maintenance should fix next based on cost, profit loss potential, etc.

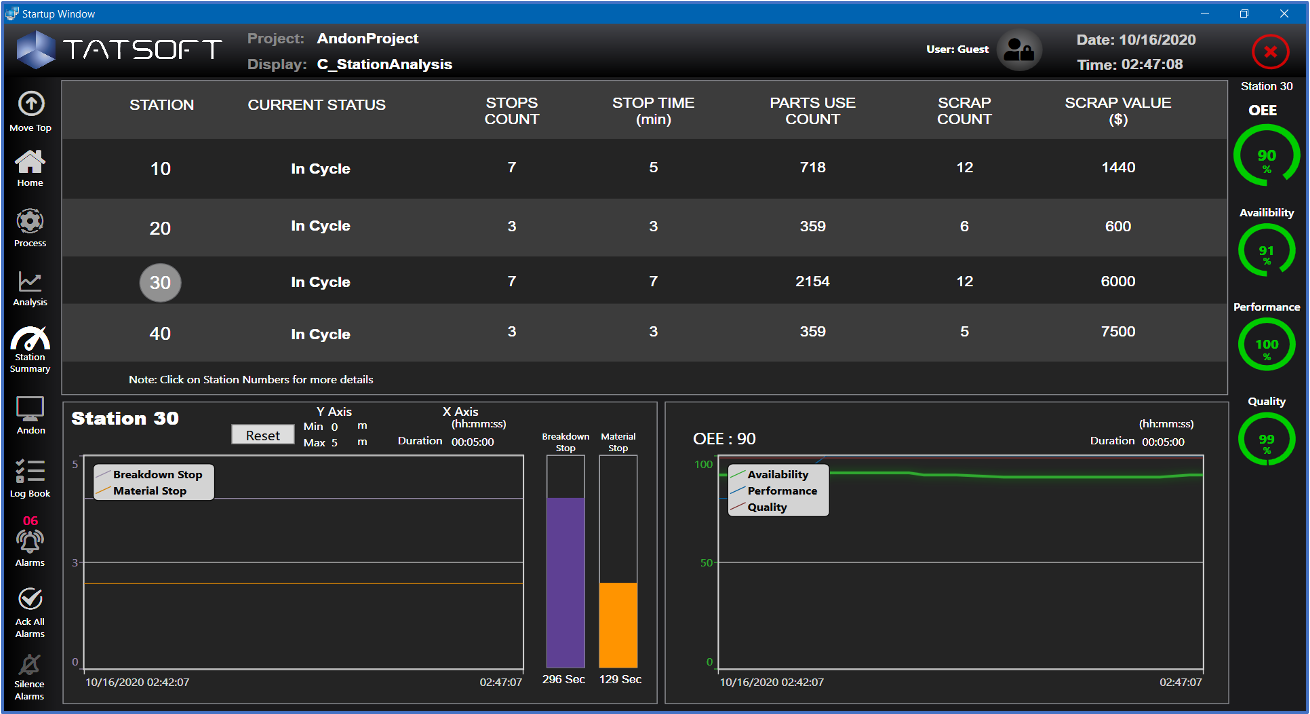
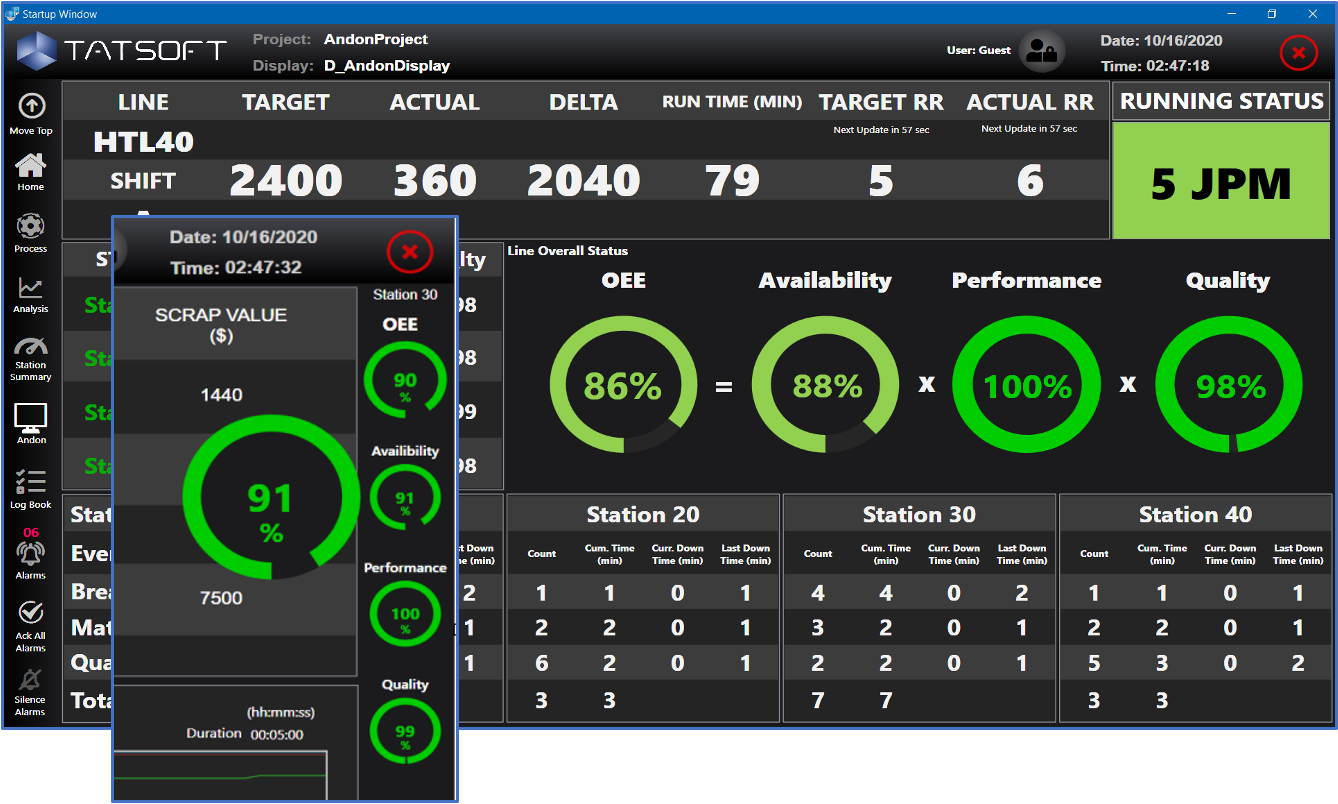
With an Andon / KPI Dashboard, whether overhead, on your phone, or at your desk, get a quick glance at the stats you need anytime.
Easily define KPI gauge color bands to quickly show when things are running great…or not.
Keep the entire team on the same page with how things are going, at a glance.
Help foster friendly team competition by displaying multi-line stats in one overview.
Make it easy to spot who’s having a great run so you can congratulate them!
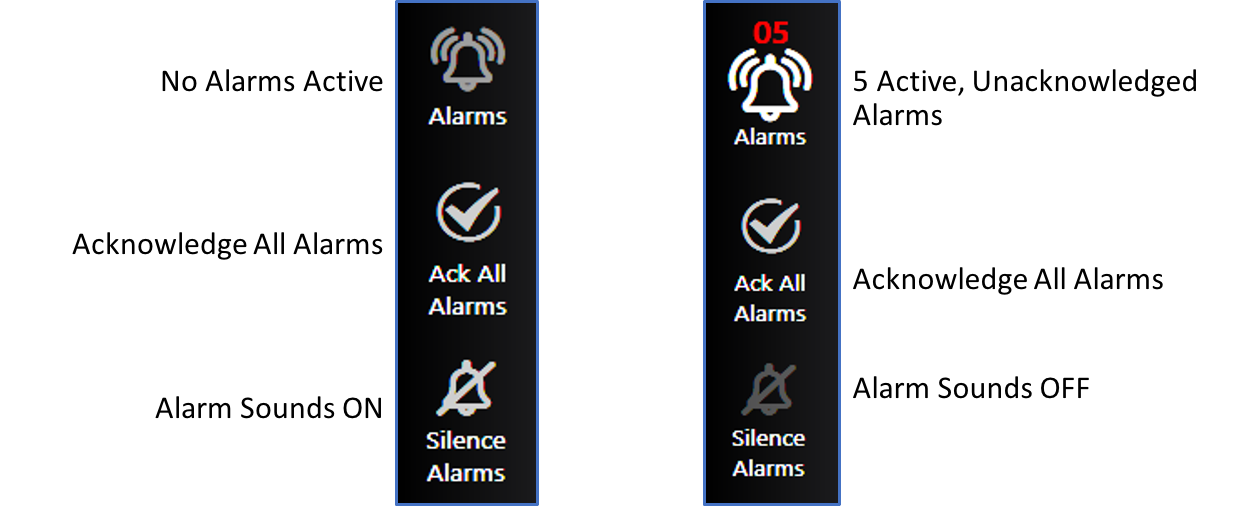
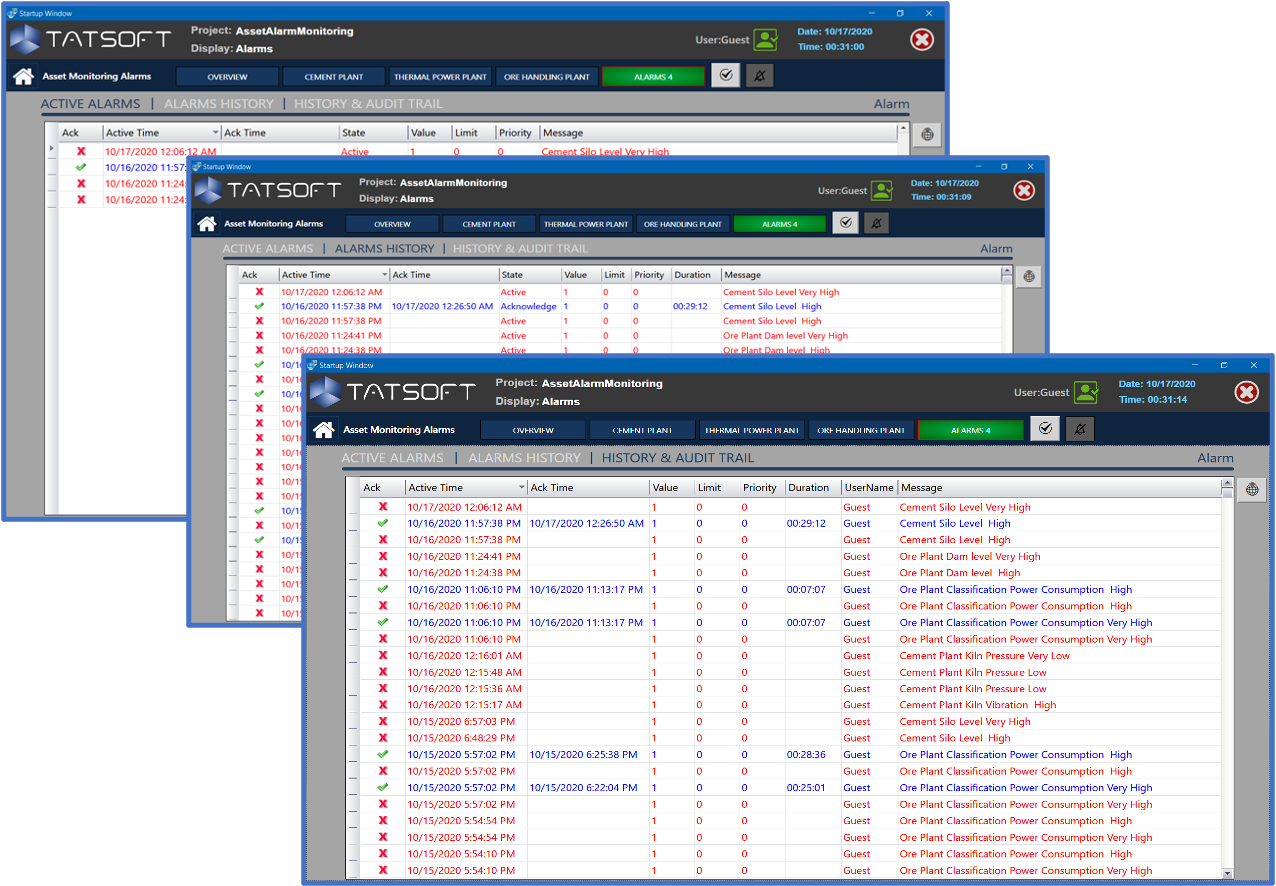
Make it easy to see, respond, and control alarm messages from any screen.
This project showcases 4 alarm management features all from the menu so you can manage things regardless of what other screen you may be using.
Visual symbols and colors help identify when there are alarms and shows you a count of how many unacknowledged alarms there are.
Easily silence alarms or even acknowledge them all at once.
And the color and size effects help you know when you’ve enabled the “silence alarms” feature.

FactoryStudio has built-in Alarm Management, Alarm History, and Alarm Acknowledgement making alerting and recording your alarms super easy.
Quickly customize what you want to show.
Show alarms on screen, or in a report.
Trigger actions based on an alarm(s).
Maximize screen space with multiple Alarm panel types.
Several of our Pre-Built Project Templates have Alarm displays and footers already built for you. Your Welcome!
Easily Acknowledge and / or Silence alarms.
Historize Alarms, Acknowledgements, messages, how long it took to acknowledge, and more.
Use our built-in database to use alarms right out-of-the-box. Or use it as a store-and-forward system to your own Historian. Or both!
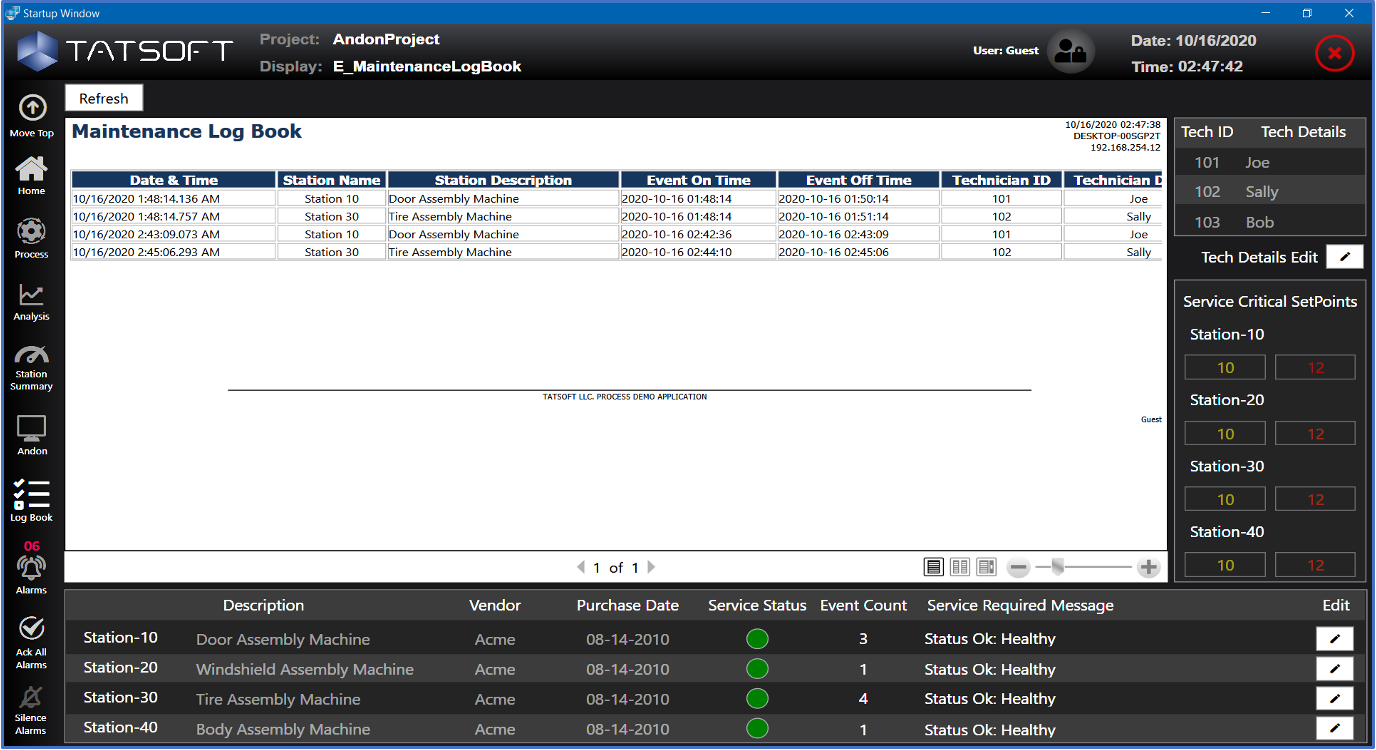
Reporting is built-in to help you with building things like a maintenance logbook, shift report, monthly overview, even regulatory reports.
Embed dynamically created charts and data tables.
Even color specific cells based on any criteria you want at the time the report is generated.
Use our built-in email component to send a report for any situation, automatically or at the push of a button.
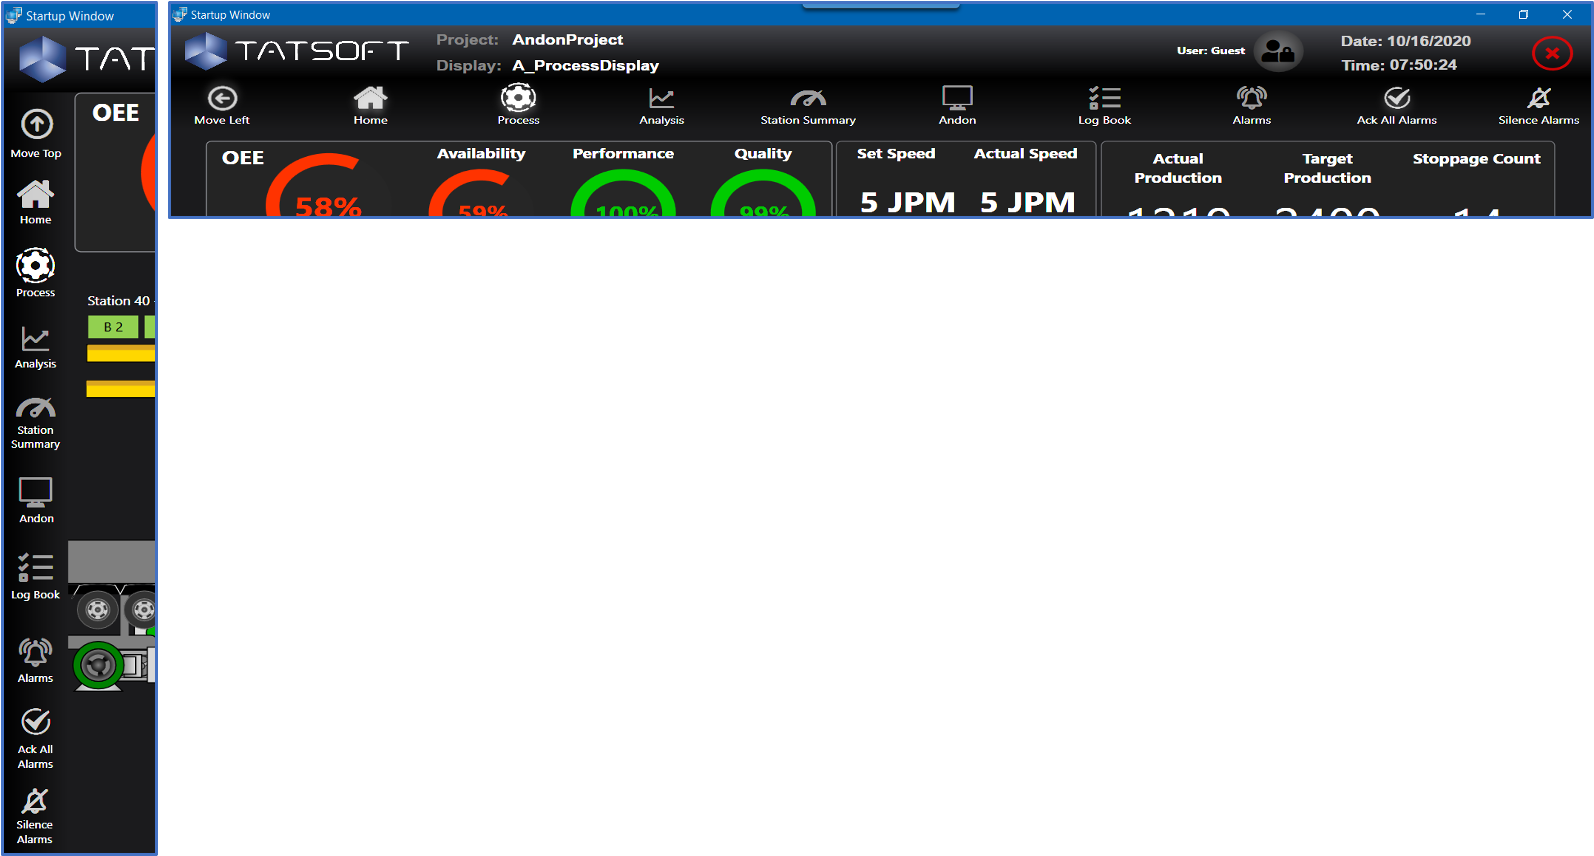
FactoryStudio makes it quick and easy to use our pre-built menus, or to create your own!
New in 9.1 is our “Industrial Icon” font – making adding an icon as easy as typing a single letter – complete with font size and color control!
Our Layout feature makes it easy to place a menu wherever it makes the most sense for your application – top, left, bottom, right – just a click away.
The Andon project features 2 menus as one possibility – starts on the left and has the option to move to the top as well!
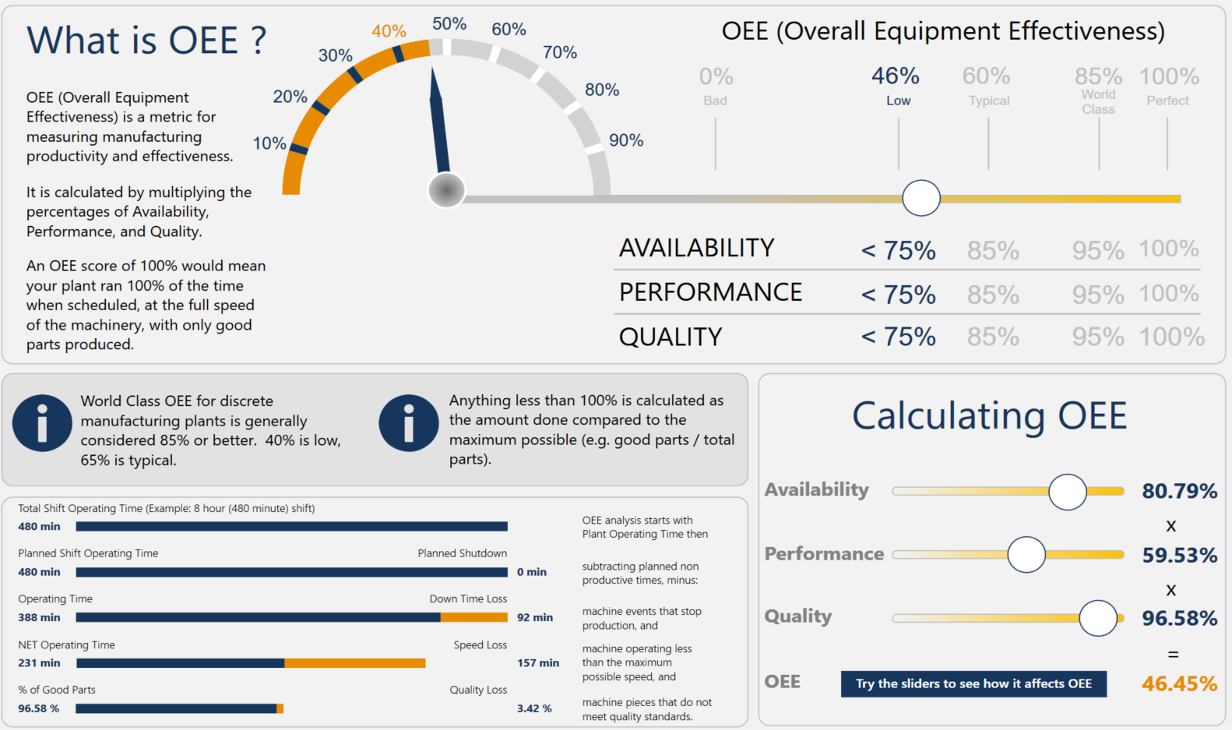
Key Performance Indicators (KPIs) are an important business tool for quickly gathering information to help speed up decision making.
With FactoryStudio you can include any calculations you need, when and where you need them.
Business metrics, OEE, JPM, Takt Time, Cycle Time, Days Worked Safe, MTTR, MTBF, even Predictive Maintenance numbers.
Show them with or without graphics, such as gauges, bar charts, trends, data grids, even enlarge them when you hover over them if you want!
Build your own library of calculations, or link to external systems for the data.
Have data from your in-house Python Machine Learning libraries – we can access that too!
We make it easy to get the data you want and display it when and where you want.
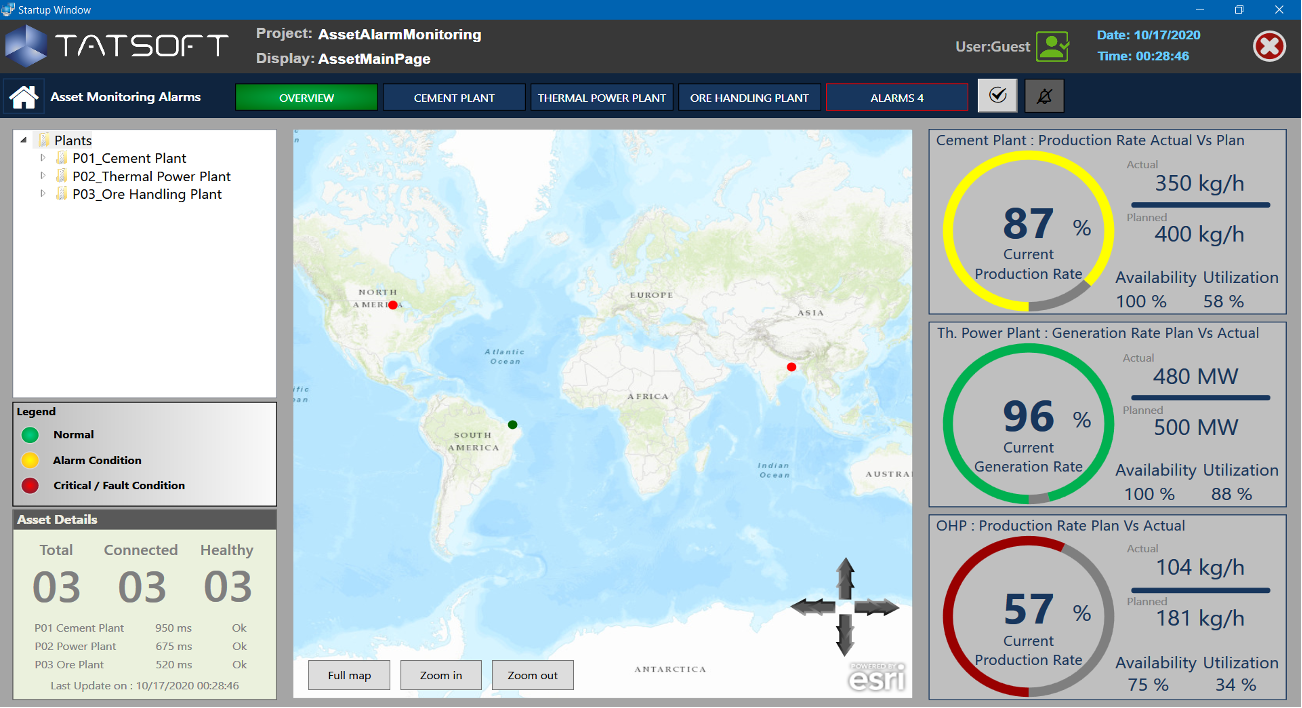
Adding interactive maps to your solution immediately adds value and context to any project.
Create a wide variety of Geographics Information Systems (GIS), for solutions such as:
- Global or Regional Information Systems
- Network Operations Centers (NOCs)
- Transportation Management Centers
- Dispatch Solutions
- Truck and Asset Tracking (with IIOT sensors)
- Employee Tracking
- Oil / Water Remote Field Operations Centers
Use maps from ESRI or Google.
Full support for adding interactive Points of Interest (POI) and zoom.
Add dynamic, real-time assigned color to represent things such as state or value.
Click a POI to trigger an action, such as map drill in, or context pop-up.

Asset Modeling is a powerful concept for increasing the amount of “knowledge”, “context”, and “relationship” to any piece of data.
Use our built-in Template creator to define custom user data types and relationships and enable time and costs savings – from project creation to end user applications, business intelligence, and machine learning.
Easily tie those templates to an object, like a pump symbol, and everywhere you use that object ALL the related template context and data INSTANTLY comes with it, allowing you to rapidly build powerful applications for any need.
Visualize your asset structure in a familiar “file-tree” format and assign context and other data types to any item.
We also support a direct connection to OSIsoft’s PI & PI AF (Asset Framework) – allowing you to see and interact with your existing AF from within your projects easily.
Using Asset Trees helps ALL your end users get the data and understanding they need without having to know things like underlying PLC tag names and structures, or guessing at needed context, such as units on a number, or location of an asset.
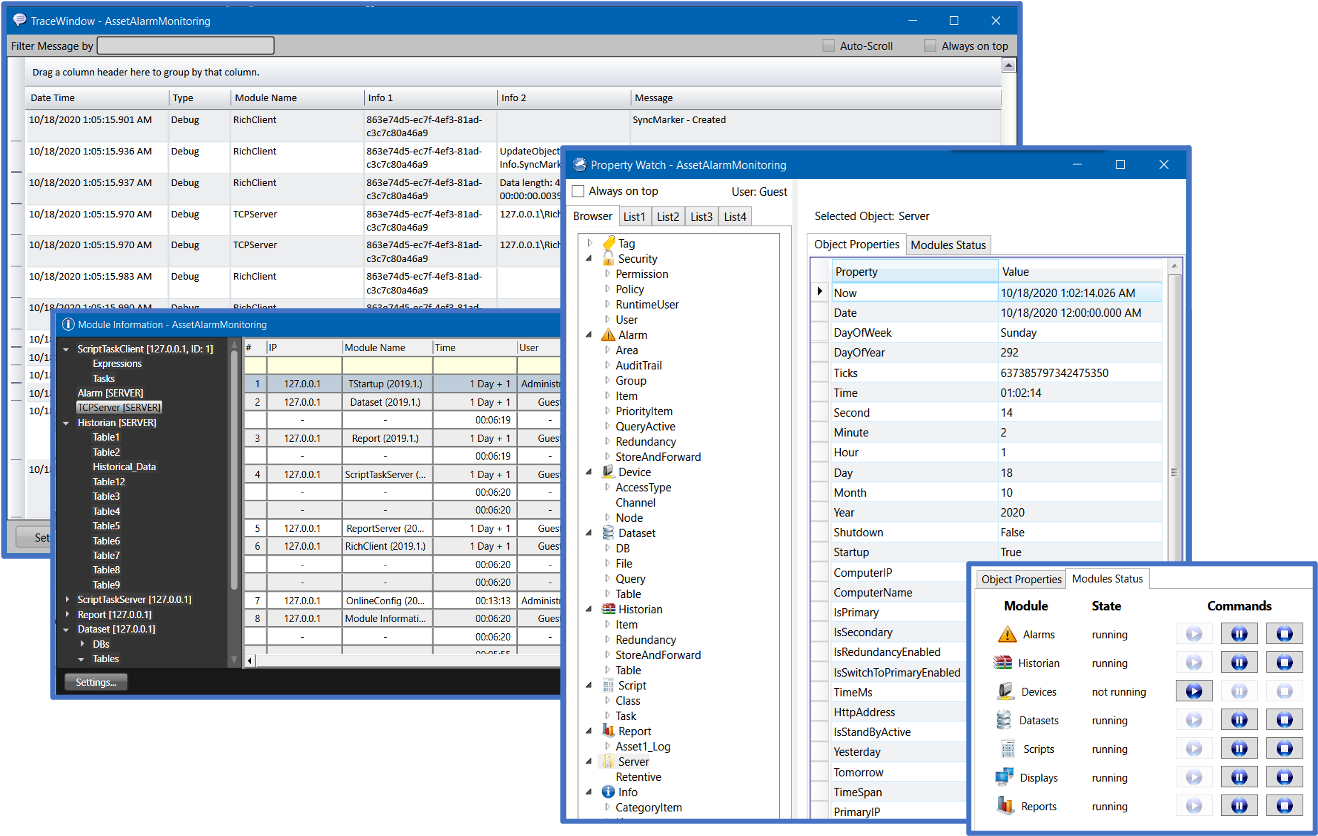
Use our built-in diagnostic tools to help monitor the health of your communications, systems and network.
All diagnostic data is also available within your project via the tag namespace, making it nearly effortless to access and use this valuable information.
Information about your connections to networks, databases, and historians, as well as metadata about those items, in addition to your tasks, scripts, reports, and alarms can help you manage, trend, alert, and report on the health and performance of your systems.
Trigger notifications and alert the right people the first time and every time with our handy alarming and email functionality.
With a KPI Dashboard Tile, whether overhead, on your phone, or at your desk, get a quick glance at the stats you need anytime.
Easily define KPI gauge color bands to quickly show when things are running great…or not.
Keep the entire team on the same page with how things are going, with just a glance.
Help foster friendly team competition by displaying multi-line stats in one overview.
Make it easy to spot who’s having a great run so you can congratulate them, or who’s in need of additional help to get up and running again.

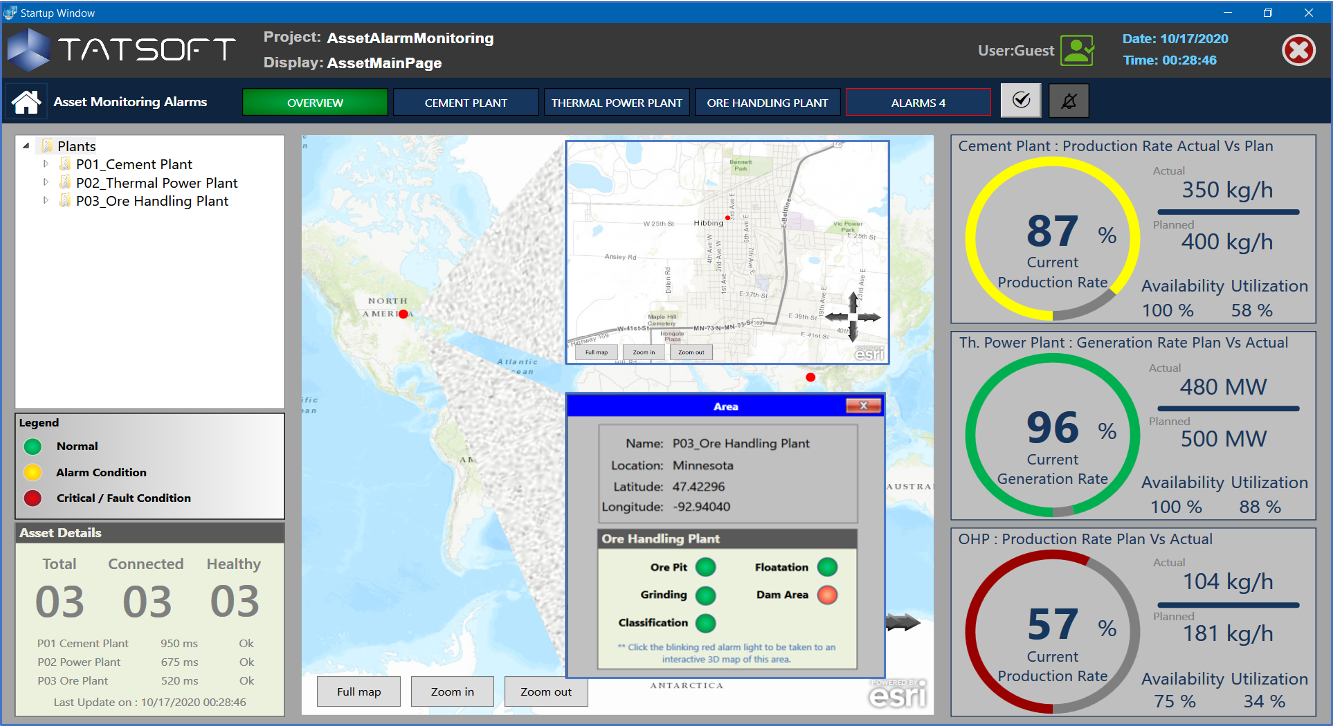
A plant overview screen is a great way to keep a holistic view on your entire operation.
Whether for a global enterprise, or a single line at the plant, use an overview screen to see KPIs and view relevant information such as state and status.
Display relevant external data such as weather, traffic delays, and current utility energy costs.
Drill in for more details by clicking on areas of interest or data tiles.
Use drawings, real images, and even embed live camera feeds.
Great for NOCs and conference rooms.
Dashboards are a great way to keep a pulse on your plant(s) – especially when they are driven by real-time data.
FactoryStudio, powered by FrameworX, gives you the secure and reliable connections you need to any device, any database, any historian, any other system (such as ERP, CMMS, WMS, etc)
Help improve your business by bringing staff actionable information at a glance.
Quickly build tiles and charts to convey important real-time data. Even embed a sparkline chart in a data grid, giving you both current values and historical performance in one small and efficient location.
Our powerful and very customizable trend charts give you lots of options to build the types of content you need.
Multi-pen, historized annotations, and multi-axis options are just the start.

Build Simulators to view and interact with systems.
Great for training and digital twins to simulate real-life scenarios in a safe environment.
Help users get used to new controls, equipment, or changes to processes.
Connect to historical data to run through past situations for Root Cause Analysis.
Experiment with various combinations of settings to help identify the real drivers of performance and process control.
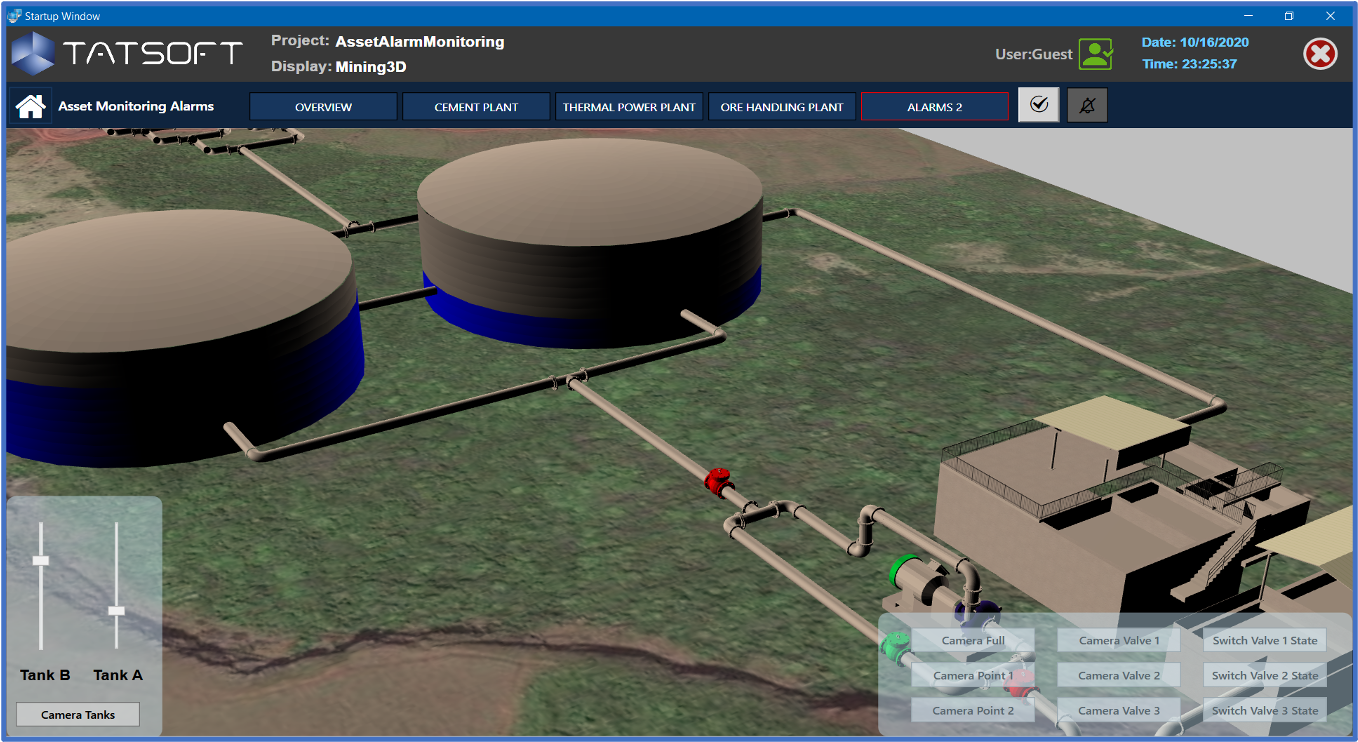
Supporting 3D files gives you another level of interaction and context to your users.
Connect real-time tags to control properties in 3D models, such as turning things on and off, and seeing it updated automatically in your drawing.
Easily click to change camera views to gain another perspective.
Build simulations, train employees, or build an overview of where equipment is at currently.
Built on top of Microsoft’s WPF native graphics capability gives you outstanding “bare metal” performance for a great experience.
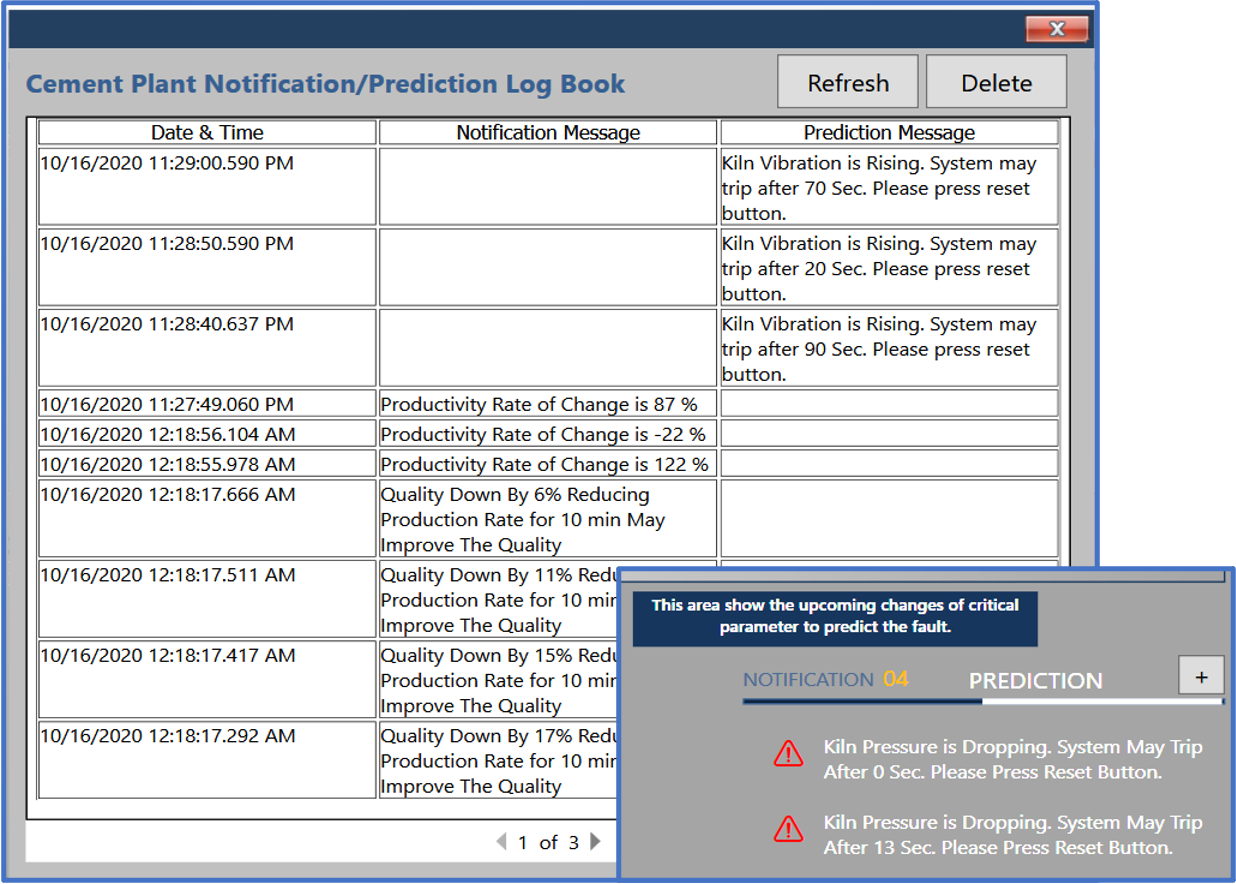
FactoryStudio supports machine learning and artificial intelligence (ML/AI) solutions via direct Code Behind, Scripting, and integration with external ML/AI solutions built with Python.
Build predictive and prescriptive maintenance and operations solutions to help keep your operators and supervisors as close to that “golden batch” / “golden run” as possible.
Use ML to pre-plan expected downtime, such as for a catalyst or heat exchanger.
Python and ML/AI integration are also featured in Tatsoft’s RIGDAP solution, built with FactoryStudio, in use for hundreds of wells worldwide, for customers such as Apache, Chevron, and Hess.
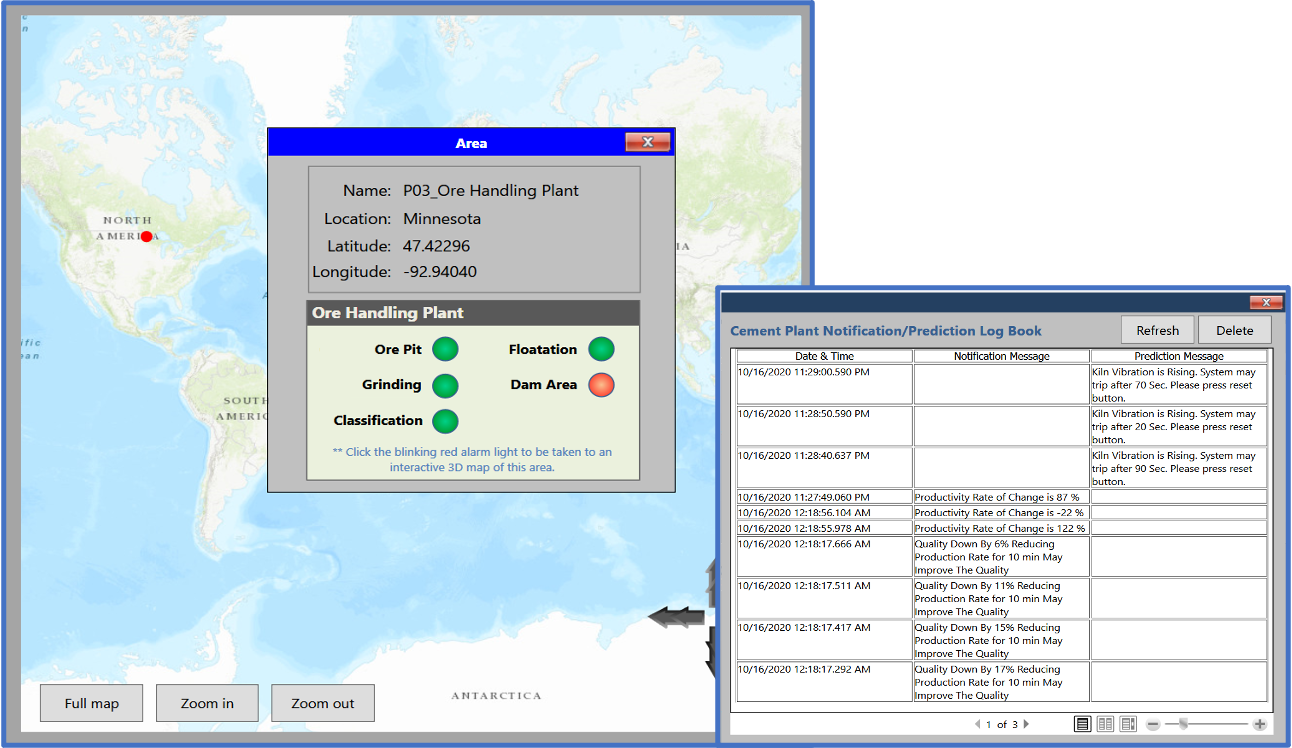
Easily create Pop-Ups or entire screens to appear when needed to help drill down for more info, or be taken to new areas.
Instead of just being flat, text-based pop-ups, FactoryStudio gives you all the same tools for a pop-up as for a full desktop screen – meaning you can make interacting with them intuitive and powerful.
In this example the map component has an interactive point of interest that opened the “Area” pop-up, which itself has a clickable area to be taken to the 3D view of the specific sub-area.
Great for providing extra functionality when and where you want it, and keeping it out of the way when you don’t.
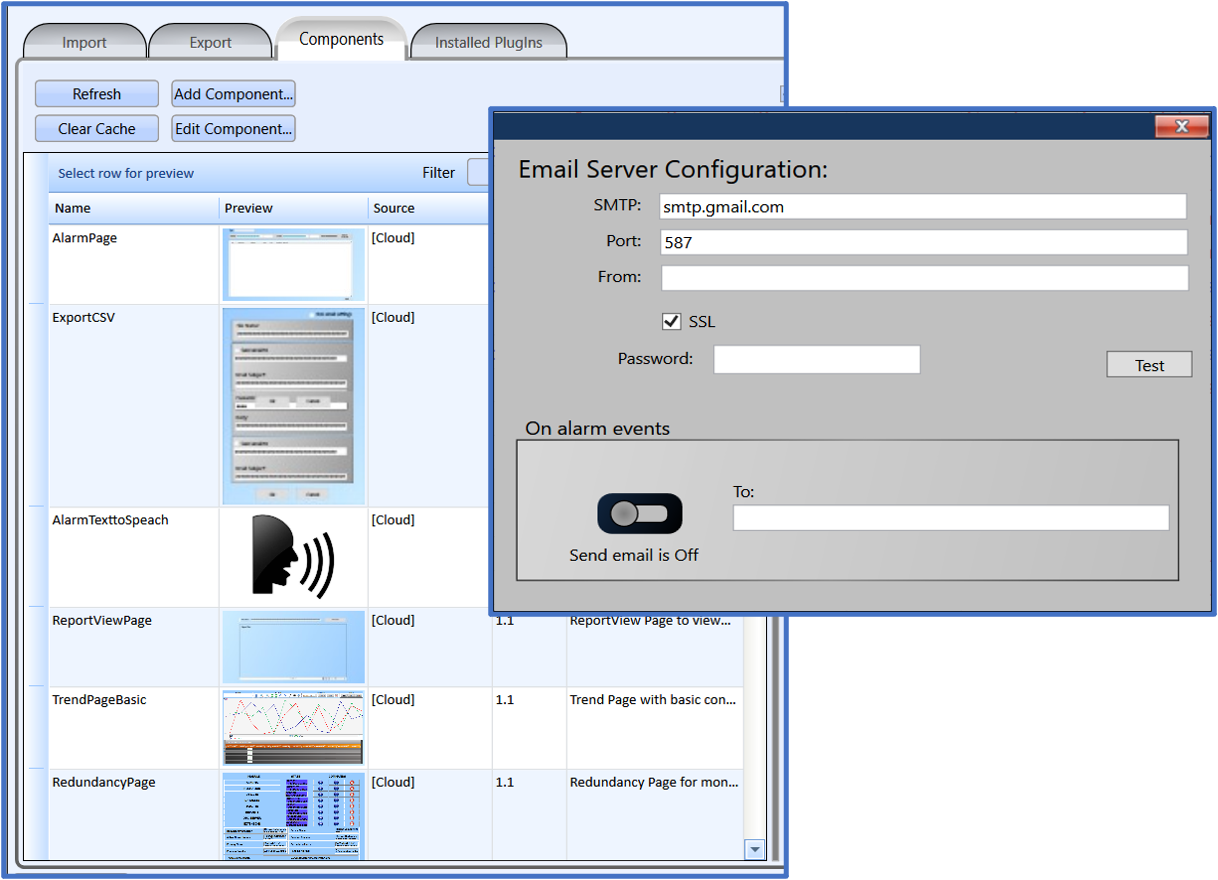
Sending alerts and reports are easy with our variety of Email, SMS (Text), and Voice (Text to Speech) Components.
Define when and to whom information should go, and send it on a schedule, like a report, or on demand from the push of a button.
Need to notify the maintenance group that a machine is down? Click!
Time to send that Shift Report to the manager? Click!
Want to ensure the daily report is sent out to the team? Well, you could click, but we’d recommend scheduling that one J
Whether you “say” it or send it you can be sure to get your message across.
FactoryStudio has built-in Alarm Management, Alarm History, and Alarm Acknowledgement making alerting and recording your alarms super easy.
Quickly customize what you want to show.
Show alarms on screen, or in a report.
Trigger actions based on an alarm(s).
Maximize screen space with multiple Alarm panel types.
Several of our Pre-Built Project Templates have Alarm displays and footers already built for you. Your Welcome!
Easily Acknowledge and / or Silence alarms.
Historize Alarms, Acknowledgements, messages, how long it took to acknowledge, and more.
Use our built-in database to use alarms right out-of-the-box. Or use it as a store-and-forward system to your own Historian. Or both!
