


Build Your First SCADA Solution with AI | Download Guide
This guide walks you through building a complete water treatment monitoring solution.
")
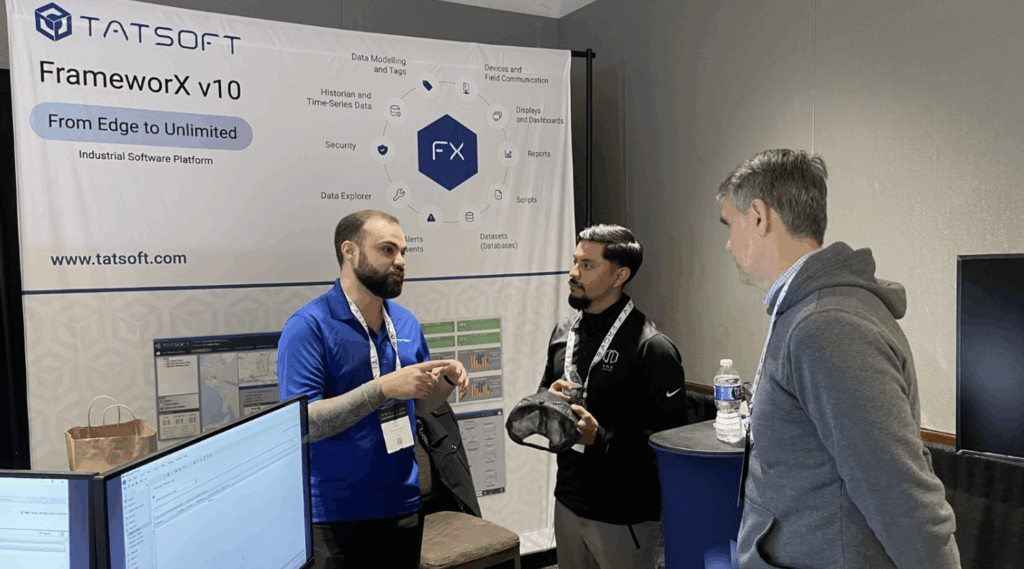
FrameworX AI Designer Launch
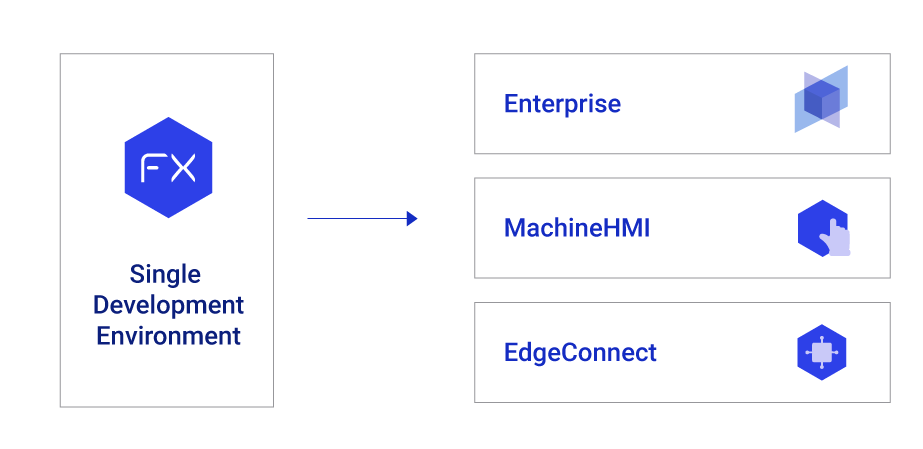
FrameworX AI Designer connects AI directly to the live Designer IDE. Describe what you need in plain language. AI creates everything.

The Autonomous Engineer | FrameworX AI Designer
This is not AI-assisted development where a chatbot suggests code snippets. This is Autonomous Engineering.