Trace Window
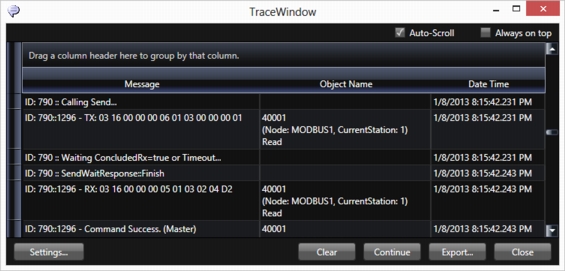
The Trace Window is a tool that displays system messages in a data grid interface. The messages contain status information (based on Edit > Channels > Settings column) about reads, writes, unsolicited, TX frames (sent), and RX (received).
 Tip:
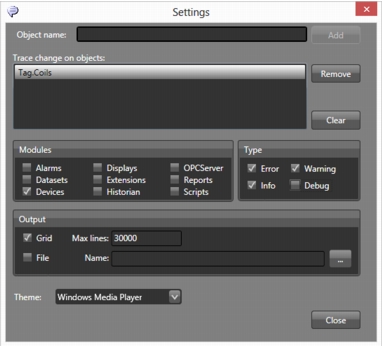
Tip: When checking the Devices check box in the Settings, enable only the error, info and warning information, not the debug information, otherwise you will create too much data. For ControlLogix devices, it is very important to use this tool, as the system will display the invalid addresses in the configuration.
Click Settings in the Trace Window to select options for which message types and modules, data format, or to save to file. You can also configure a tag in the Object Name field and click Add to select that object to include on the monitoring.